Graphical Depictions of Sets
In the previous section, we defined the complement, union, intersection, difference, symmetric difference, multiple union, and multiple intersection of sets purely symbolically. While the symbolic definitions are precise, it’s often easier to build an intuition for what these operations actually do by picturing them.
The standard way to picture a set is as a circle, with each circle drawn inside a rectangle standing for the universe $\mathcal{U}$. Whenever an operation includes some region formed by these circles, we shade that region green.
Complement
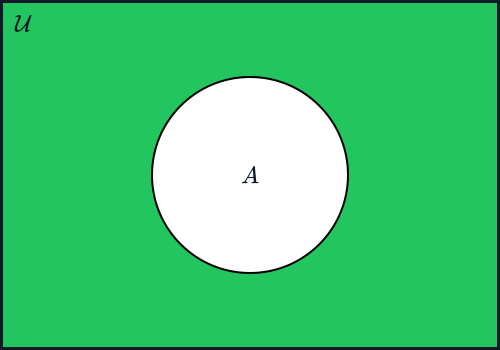
Since the complement of $A$ consists of everything in the universe that isn’t in $A$, the circle for $A$ itself is left unshaded, while everything else within the surrounding rectangle is shaded to represent $A^C$.
Union
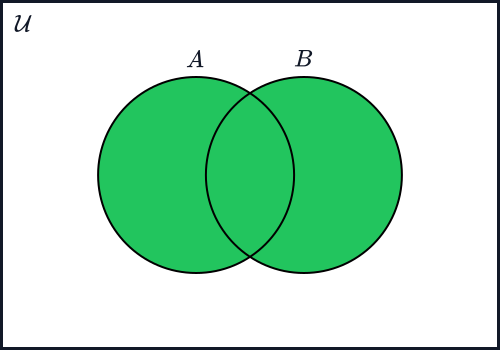
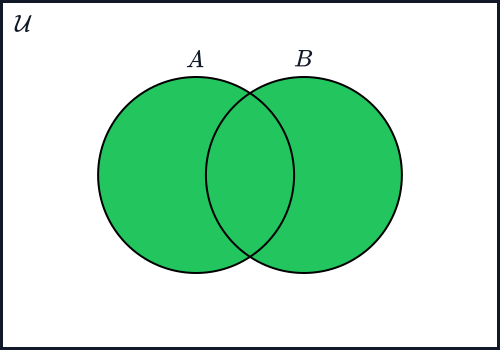
As long as an element is in $A$ or $B$, or even both, it’s included in the union — so both circles are shaded in their entirety, overlap included.
Intersection
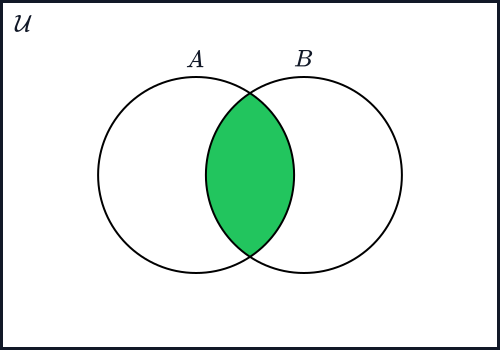
Here, only the sliver shared by both circles is shaded, since that’s the only region representing elements common to both $A$ and $B$.
Difference
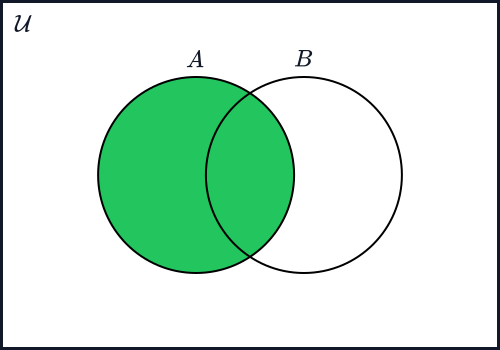
Only the part of $A$’s circle left over once the overlapping sliver shared with $B$ has been carved away is shaded.
Symmetric Difference
The symmetric difference shades everything covered by either circle except the overlapping sliver shared by both — everything a union would shade, minus whatever an intersection would shade.
Multiple Union
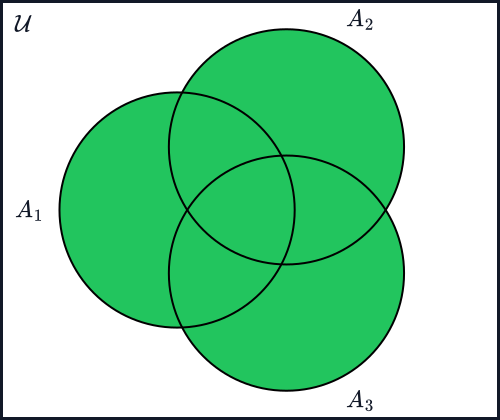
This same idea of shading extends naturally to more than two sets at once — every region covered by at least one of $A_1$, $A_2$, or $A_3$ is shaded to represent their multiple union.
Multiple Intersection
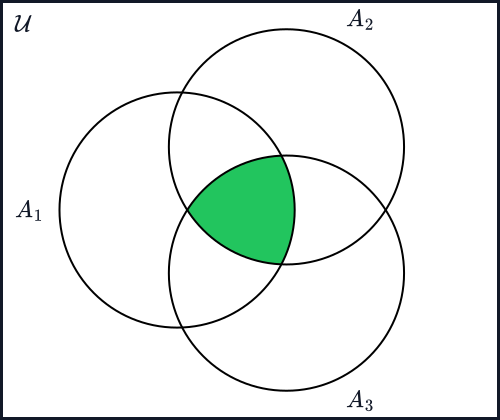
Here, only the single region shared by all three circles at once — where $A_1$, $A_2$, and $A_3$ all overlap — is shaded, representing their multiple intersection.